
6 Execution Harnesses and Tool Isolation
“We shape our tools and thereafter they shape us.”
— John Culkin, Saturday Review (1967) (Culkin 1967)
Culkin, John M. 1967. “A Schoolman’s Guide to Marshall McLuhan.” Saturday Review, 51–53, 70–72.
Author’s Note. John Culkin, an American media scholar explaining Marshall McLuhan’s ideas, originally used this line to describe how our tools reshape our own practices. In our work, an architecture tool similarly defines what a given method can tweak and what we can actually observe. If an AI-assisted method drives that tool, we must explicitly declare those limits.
North-Star question
What exactly must be wrapped around real architecture tools so that an automated method can drive them safely, reproducibly, and strictly within declared limits?
A tool command is not an environment. An architect can launch a simulator, compiler, formal engine, or physical-design flow and still be unable to say which candidate ran, which state the tool inherited, what an unfamiliar warning meant, or whether a retry repeated the same work. Traditional workflows absorbed that gap interactively: we launched CAD tools by hand, inspected log files, and adjusted scripts as we went. AI-native loops remove that human buffer. Automated methods dispatch tool invocations far faster than we can inspect the surrounding execution state for each attempt, and without an enclosing environment that enforces a state-isolated, typed boundary, the loop collapses into non-reproducible execution noise.
Suppose we want to evaluate a heterogeneous mobile XR SoC targeting a TSMC N7 or 3 nm-class LP process node under a 3 W TDP envelope, balancing RISC-V application core execution against a matrix-multiply NPU tile and dual LPDDR5X memory channels. To evaluate candidate configurations, we use a quick analytical or SRAM model to filter candidates before we send the survivors into tightly budgeted rounds of cycle-level simulations, formal property checks, and physical synthesis runs. For this to work, our tools must reliably return physical estimates, matched workload results, warnings, run failures, and the actual resources spent. If a run loses track of a candidate’s identity or mismatches our test conditions, it might hand us plausible numbers for the wrong comparison. Worse, if a tool silently retries without limits, we could blow past our declared study budget.
Even if our initial request explicitly identifies which tools to use, it is rarely ready to execute as-is. We have to translate each conceptual candidate into the exact configuration format our tool expects. The workload, software stack, shared libraries, process assumptions, and specific tool versions all need to travel alongside that configuration. We also know that long-running jobs will sit in queues and wait for licenses. Tools will crash, time out, drop reports, or even falsely report success after running the wrong top-level design. When the dust settles, our returned files might trickle back hours later and out of order.
This is exactly why we build an enclosing environment to handle these messy mechanics. As the third technical building block of Architecture 2.0, tool-connected execution environments provide the containerized execution harnesses that insulate automated loops from raw CAD toolchain complexity. A robust environment records that our requested work reached the specified tool in a known, named state and preserves what that attempt produced. It does not establish that the resulting metric is scientifically valid, nor does it tell us whether the candidate is good. We must maintain this distinction. Executing a well-formed run is not the same as supporting an architectural claim. To interpret the data and judge the claim itself, we need targeted verification feedback in Chapter 7 that sits well outside the environment’s responsibilities.
Learning objectives
This chapter establishes the following learning objectives:
- Distinguish tools and simulators from their wrappers, harnesses, and enclosing environments.
- Pin environment state across hardware, software, and tools to support replay, expose drift, and make reproducibility claims testable.
- Design typed tool interfaces that precisely translate intent and return structured artifacts.
- Coordinate multi-tool asynchronous workflows within strict resource and permission boundaries.
- Separate execution failures from design-limit violations while preserving lineage.
6.1 Hardware and Software Evaluation Environments
When we dispatch a design request to a hardware toolchain, we rarely encounter a single monolithic component capable of taking our representation all the way to a verified architectural verdict. Instead, our execution path weaves through disparate compilers, simulators, formal provers, and synthesis flows, each maintaining its own assumptions and execution quirks. If we try to bundle tool invocation, state isolation, and result interpretation into a single ad hoc script, our evaluation pipeline becomes impossible to debug or reproduce. To maintain clarity across these multi-stage workflows, we separate the responsibilities along this path into five distinct roles. Think of a tool as a race car engine, a wrapper as the driver controls, the harness as the pit crew recording lap telemetry, and the environment as the entire enclosed test track.
- A tool transforms an artifact or analyzes a stated property under our declared inputs and conditions. We consider compilers (such as LLVM and TVM), SRAM models, domain estimators (such as SCALE-Sim and Ramulator 2), simulators (such as gem5, Verilator, and VCS), RTL testbenches (such as Cocotb), formal property engines (SVA/BMC), synthesis tools (such as Yosys and Vivado), and physical design flows (such as OpenROAD and OpenSTA) to be tools.
- A simulator is just one kind of tool. It executes a model of hardware and software behavior, returning only the behavior its model exposes. It never serves as the complete environment.
- A wrapper surrounds a single tool. It validates our request, translates that request into tool-specific inputs, invokes the tool, and parses the returned files.
- A harness coordinates our wrappers. It records our attempts, state, costs, failures, retries, resets, and produced artifacts.
- The environment is everything connecting our study to its underlying tools. It defines the state our method may observe, the requests we may issue, the tools we can reach, and the returns we expect to receive.
For example, we might build an XR SoC design environment containing wrappers across functional tool categories, encompassing architectural simulators, formal verifiers, gate-level logic synthesis, physical design signoff flows, hardware emulators, and FPGA-accelerated target platforms. We then rely on one harness to keep their collective outputs, from NPU MAC utilization and memory traffic latency down to placed-and-routed timing slack, tied to the same candidate and experimental conditions. To prevent host microarchitectural contamination (where background host OS kernel scheduling or host CPU frequency scaling can perturb host-time-dependent results such as wall-clock throughput and realized-cost accounting, though not the cycle counts of a fully deterministic simulation), our harness enforces hermetic execution environments via Nix build graphs and containerized OCI image digests (sha256:...) with pinned glibc/EDA tool binary checksums. Commercial EDA tools relying on floating license daemons (FlexLM and Sentinel) receive explicit license environment variables (LM_LICENSE_FILE) passed through dedicated harness sockets without granting broader host network access.
We make this distinction because it is structural, not cosmetic. A simulator remains just a tool even if we give it a convenient Python interface, and a wrapper still serves only one tool at a time. While our harness can coordinate several wrappers, it only becomes part of an environment when we use it to inspect relevant state, issue bounded requests, and receive identifiable returns.
We must ensure each request survives its full journey from a known starting state to an identifiable return. During setup, we establish our design, software, workload, tool, and resource state. Our interfaces and wrappers define exactly what we can request and translate it precisely. The runtime and harness then schedule, isolate, budget, cancel, retry, and record our work. Finally, our return includes the execution status, artifacts, parsed results, warnings, cost, and lineage. We maintain these responsibilities regardless of whether we, a conventional search, or a learned method issue the request.
While our broader design workflow uses the environment, it does not belong to it. We use the workflow to direct the ordering of design tasks, method decisions, interpretation of returned results, and human review. The environment merely executes our authorized requests and exposes identifiable returns back to that overarching workflow.
Before submitting work, we must be able to inspect the candidate, fixed state, supported tool operations, resources, and prior attempts. The environment then accepts only our declared requests, returning the execution status, raw artifacts, parsed values, unclassified text, cost, and lineage. The pipeline isolates request validation, tool execution, parsing, and harness recording into dedicated stages (Figure 6.1).
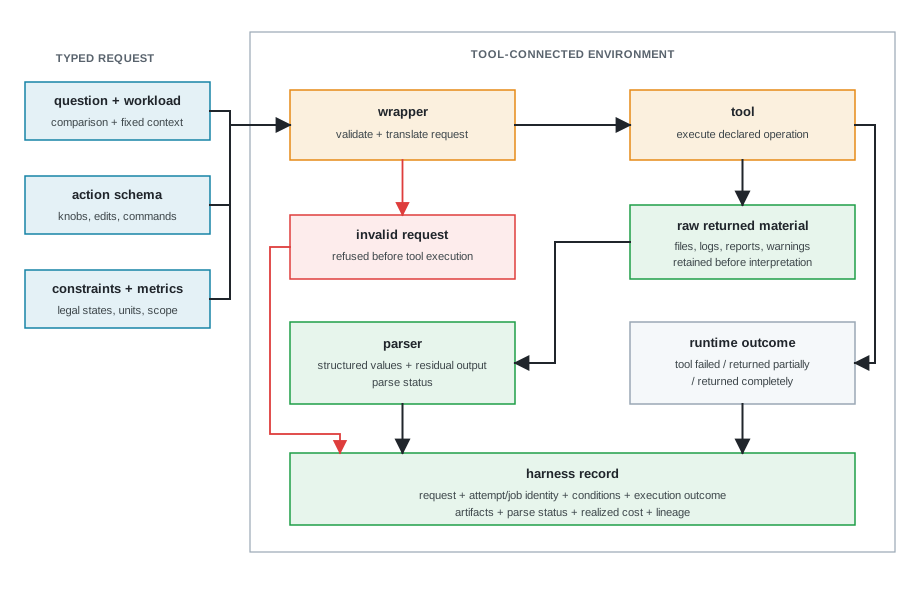
Our design question and workload enter the environment wrapped within a typed request containing action schemas, constraints, and metric definitions. Our wrapper first validates and translates this request. If the request violates schema bounds, our wrapper immediately routes it to the harness as a refused attempt without invoking the backend tool. For valid requests, our tool executes the requested operation and returns raw output alongside a runtime outcome marked as failed, partial, or complete. Next, our parser processes the raw output into structured attributes while preserving any unclassified residual text and emitting an independent parse status. Finally, our harness binds the request identity, operating conditions, runtime outcome, parsed attributes, realized cost, and lineage into an immutable execution record. When we maintain strict boundaries between these four stages, we ensure that a parser failure never misrepresents a finished tool run as an infrastructure crash, nor can a clean parse elevate a partial output into a complete architectural result.
We face challenges when building this kind of environment because our architecture tools often inherit state that our request never names, and they return more material than we asked for.
6.2 Stateful Tools and Partial Execution Returns
Unlike lightweight web APIs or pure functional routines, EDA and architecture evaluation tools never act as stateless microservices. They leave sprawling file footprints across working directories, lock proprietary license tokens, consume versioned design databases, and quietly inherit environment variables from the host operating system. When a long-running synthesis job or cycle-level simulation fails midway through execution, we are often left wrestling with truncated log files, incompatible unit definitions, and unreleased license seats. No off-the-shelf software sandbox will automatically manage these hardware-specific behaviors for us. To evaluate even a single candidate reliably, we must explicitly validate tool state before every invocation and retain complete raw transcripts.
Take OpenROAD, for example, which exposes stateful Tcl and Python interfaces over a complex design database (The OpenROAD Project 2026); Xilinx Vivado follows the same stateful Tcl pattern. Commercial simulators like Synopsys VCS and formal engines using SystemVerilog Assertions and Bounded Model Checking (SVA/BMC) likewise maintain persistent compilation state and intermediate coverage databases. When we build a wrapper for such a tool, we must establish or validate the declared state before every invocation. We need to hook into the tool’s error mechanism to return an explicit status and serialize the recognized parameters. We must also retain the raw transcript and any unclassified output. While a clean, structured record is useful, it is not enough if we discard an unfamiliar warning during the parsing process.
In our real-world projects, we also inherit intellectual property (IP) blocks, NPU compiler toolchains, software stacks, constraints, generated files, vendor models, and tool databases. While our environment does not need to expose protected contents beyond what a specific study authorizes, we must preserve the exact identity, version, permitted use, and dependent state carried into each invocation. If we fail to track these details, a repeated request might look identical on the surface while running against a different design or model underneath.
A typical implementation flow illustrates this problem. OpenROAD provides read_liberty for loading Liberty library views (.lib files containing characterized cell delays, setup/hold constraints, and power specifications) and read_lef for loading Library Exchange Format (LEF) technology and macro physical layout data (The OpenROAD Project 2026), while Yosys ingests cell libraries for logic gate mapping. Power management intent across low-power multi-voltage XR SoC domains is governed by IEEE 1801 Unified Power Format (UPF) specifications. In an XR SoC design, an NPU accelerator block, LPDDR5X memory controller, or SRAM macro might appear as a behavioral C++/RTL model in Verilator, a Liberty timing and power view during Yosys or Vivado synthesis, a UPF power intent specification during power-gating insertion, and a LEF physical view during OpenROAD placement and routing. If we update the behavioral RTL model but retain an un-updated, stale Liberty library view or inconsistent UPF power-domain file from a previous cache, we allow different stages of our toolchain to evaluate conflicting physical, timing, and power-gating versions of what we treat as a single macro. This mismatch can produce clean signoff reports for designs that suffer from unisolated power rails or physical timing failures on silicon. To prevent this, our environment must bind compatible views to a single identity, or outright refuse to run.
We must insist that translation is exact; otherwise, it must be refused. If our study asks for l2.capacity=3MiB, npu.mesh=16x16, or mem.channels=2, our wrapper might serialize those values into SRAM configuration files, compiler flags, and simulator parameters. However, we cannot let the wrapper silently round a cache capacity to the nearest power of two, shrink NPU mesh dimensions to force a legal floorplan, or quietly substitute another simulator just because it happens to be idle. Every one of those substitutions changes the meaning of our request. While we can use a syntax-preserving repair to create a new request artifact or execution attempt (retaining the candidate identity), our wrapper must refuse any repair that alters architectural meaning. Instead, it should return a validation failure straight back to the candidate-producing caller. From there, the caller can leverage the enclosing lifecycle to generate a fresh candidate. We only reopen method selection if the failure invalidates our chosen approach or its supported action space.
Lighthouse prompt: One XR SoC request, several exact translations
Our 3 MiB cache, \(16 \times 16\) NPU array, and dual LPDDR5X memory channel candidate becomes a single SRAM and NPU analytical model input under our declared process, voltage, and temperature conditions. If our predeclared routing conditions permit, it also becomes a gem5 and Verilator simulation configuration linked to our specific NPU model, memory traffic generators, XR workload trace, and baseline software image. While our wrapper has the freedom to adjust file syntax, paths, and command-line spelling, we forbid it from changing the cache policy, NPU systolic topology, memory controller arbitration, compiler runtime, workload, or any other architectural property. If the translation remains exact, we proceed. Anything else we refuse and record.
This narrow rule prevents a common failure mode: an automated repair makes a tool call legal by silently altering the very design we set out to evaluate, so the tool reports success on results that belong to a different candidate. Our request validation catches these mismatches before we burn expensive cluster time. To perform this exact validation, we first need an unambiguously identifiable starting state.
6.3 Environment Setup, Dependencies, and Lineage
When an automated evaluation flow yields an unexpectedly high throughput metric or an uncharacteristically tight timing slack, we must be able to prove whether that result came from a genuine architectural improvement or an unrecorded environmental drift. Shifting tool versions, updated vendor libraries, or leftover temporary files can skew an evaluation without raising a single runtime error. To establish confidence in our data, every requested run must originate from a pinned starting state, backed by cryptographic tracking of every design transformation along the way.
We define lineage as the parent-child history linking our requests, transformations, and artifacts. This history allows us to trace which inputs produced a given result, and to verify whether a subsequent retry, software image, or hardware artifact actually belongs to the same candidate design.
While pinned state is necessary, it is not sufficient on its own. A simple retry might duplicate billable work, a crashed process could contaminate our next attempt, a flawed reset might restore an incorrect baseline, and improperly reused output can bleed across candidate or condition boundaries. Therefore, we need rigorous rules for failure, retry, reset, containment, and retention to prevent runtime behaviors from quietly altering our request’s meaning or inflating its realized cost. We formalize these operational rules in our prospective XR SoC run specification, summarized in Table 6.3 in Section 6.10.
We treat the versioned source, workload snapshots, constraints, libraries, PDK views, tool images, and baseline artifacts that kick off a run as immutable inputs. In contrast, our mutable work state encompasses the run directory, generated files, tool databases, checkpoints, scheduler state, and any other artifacts our requested action might alter. Our evaluation harness never patches immutable inputs in place; instead, it generates a fresh working state tied to those inputs and logs every authorized mutation.
When we talk about a reset, we mean fully restoring a declared starting state, not merely invoking a function called reset. A clean reset regenerates our working directory and tool state from pinned inputs, whereas a checkpoint reset resumes from a verified intermediate database as long as its parent inputs and validity conditions remain identical. Before we consume scarce execution cycles, our setup checks must confirm the expected top level, clocks, constraints, libraries, workload, tool version, and artifact set.
Our architecture tools rarely directly consume the high-level representation we used to formulate a study. For instance, an SRAM model requires a detailed organization and technology configuration, while a gem5 or Verilator simulator expects a platform description, an NPU binary image, and specific microarchitecture and memory bus parameters. Compilers and synthesis engines lower high-level code into intermediate representations, transforming Abstract Syntax Trees (ASTs) and Control-Data Flow Graphs (CDFGs) down to gate-level netlists. A power model might ingest activity and event counts produced by a different tool. Our environment must lower a single candidate into these varied formats while preserving its parent relationship across AST, CDFG, RTL, and physical netlist representations.
To track these complex identities and outcomes, we maintain a complete transformation record that captures:
- the parent candidate and request;
- the transformation and tool version;
- input identifiers and content hashes, where useful;
- fixed conditions inherited from our broader study;
- the output artifact alongside its hash;
- whether the transformation successfully preserved our intended architecture meaning; and
- the next authorized consumer.
When our serialization only modifies syntax, we retain the original candidate identity. This distinction becomes critical when our wrapper steps in to repair a malformed file. For example, adding a missing quote around 3MiB clearly preserves the original meaning, but shrinking an NPU array dimension merely to appease a rigid parser breaks it.
While content hashes allow us to cleanly distinguish exact artifacts, they do not inherently prove that two artifacts are functionally equivalent or represent the same underlying architecture. We look to build systems like Bazel, a multi-language build tool, as strong examples of using declared dependencies and cached actions to enforce consistency (Bazel Project 2026a, 2026b). Yet even with such rigorous discipline, hidden tool state can still undermine our reproducibility, which is why our harness records both the final hash and the exact execution conditions.
Bazel Project. 2026a. Dependencies. Bazel documentation. https://bazel.build/concepts/dependencies.
Bazel Project. 2026b. Remote Caching. Bazel documentation. https://bazel.build/remote/caching.
Pham, Hung Viet, Shangshu Qian, Jiannan Wang, et al. 2020. “Problems and Opportunities in Training Deep Learning Software Systems: An Analysis of Variance.” Proceedings of the 35th IEEE/ACM International Conference on Automated Software Engineering (ASE), 771–83. https://doi.org/10.1145/3324884.3416545.
Random seeds represent only one dimension of variation control. Execution harnesses must also pin worker thread counts, scheduler placement, parallel reduction ordering, host library dependencies, and concurrent job timing. Empirical audits of deep-learning training find that implementation-level nondeterminism in GPU execution silently introduces run-to-run variance across identical runs and corrupts evaluation repeatability (Pham et al. 2020). When an EDA tool or simulator relies on stochastic search heuristics, our environment wrapper must enforce explicit seeds and log execution noise. Unrecorded variation converts deterministic verification contracts into uncalibrated, noisy observations.
When we introduce larger hardware and software changes, we must explicitly track how downstream evaluation artifacts inherit their identity from a shared parent intent, as demonstrated in Figure 6.2. A single root intent might branch out to produce an array of different software binaries and RTL artifacts.
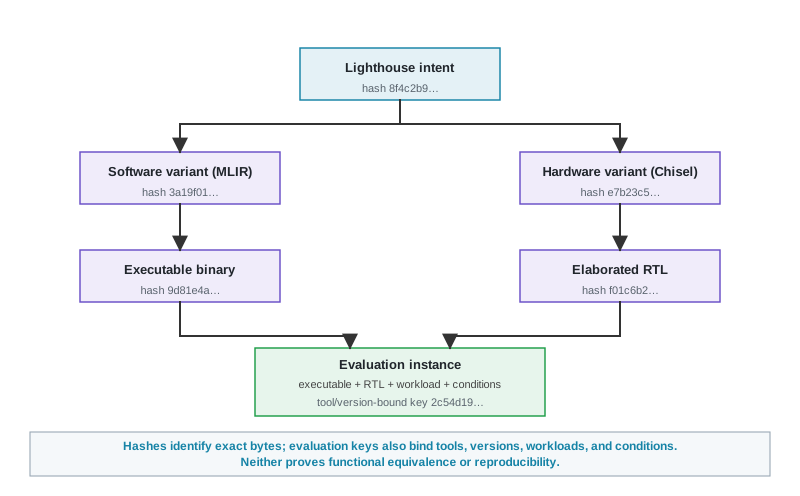
A single root Lighthouse intent branches into two parallel transformation paths (Figure 6.2). A software variant compiles through an identified toolchain into a specific executable binary, while a hardware variant elaborates into a uniquely identified RTL artifact. Our evaluation instance binds this compiled binary and elaborated RTL artifact together under a single evaluation key that incorporates tool versions, workload snapshots, and operating conditions. If we alter either child artifact or modify an operating condition, we generate a new evaluation identity even if our high-level intent remains unchanged. Cryptographic hashes uniquely identify individual files, while the complete evaluation key preserves the parent-child lineage needed to reconstruct the comparison and attempt a replay. It cannot guarantee that a later execution realizes identical conditions or returns identical results.
Hidden or mismatched conditions can invalidate an identity match just as quickly as a stale artifact. When we receive an SRAM-model return, it carries circuit and technology assumptions bound to its declared process, voltage, and temperature settings. Likewise, an OpenROAD or Vivado implementation return is permanently tethered to its specific corner, mode, libraries, constraints, and flags. The returns we pull from cycle-level simulation, cache models, and power models carry equally heavy baggage, including workload, software, warm-up length, measured region, seed, checkpoint, and model configuration. Our environment must retain all conditions that apply to each tool, safely marking any nonapplicable parameters without independently judging if those conditions are sufficient. A timing-slack return of \(-12\,\mathrm{ps}\) at a slow process corner is not interchangeable with the same numeric return taken at a typical corner. The number itself must travel directly alongside the conditions that give it meaning.
We must also recognize that our host environment itself can warp a result. Mytkowicz et al. (2009) showed that something as mundane as link order or UNIX environment size can perturb measured performance by a margin larger than many touted optimizations. If we give an optimizer enough attempts, it will exploit these effects. When we pin and record the binary, host, environment variables, and flags, we prevent accidental host discrepancies from masquerading as genuine candidate improvements.
Mytkowicz, Todd, Amer Diwan, Matthias Hauswirth, and Peter F. Sweeney. 2009. “Producing Wrong Data Without Doing Anything Obviously Wrong!” Proceedings of the 14th International Conference on Architectural Support for Programming Languages and Operating Systems (ASPLOS), 265–76. https://doi.org/10.1145/1508244.1508275.
While our pinned state firmly establishes the foundation from which a run begins, our task does not end there. Our wrapper must now expose the specific changes a method is allowed to request, doing so without erasing the meaning behind the tool-specific return.
6.4 Typed Contracts for Hardware Tool Interfaces
Once we pin our starting state, we face the challenge of communicating cleanly across tools that speak fundamentally different languages. A microarchitectural simulator might express cache capacities as plain integers, while a physical synthesis tool expects string attributes with explicit unit suffixes, and a formal checker demands Boolean invariant expressions. If our tool wrappers pass unvalidated types or ambiguous numbers between these engines, minor translation errors can quietly corrupt our design space search. To prevent these quiet failures, we construct rigid, typed schemas for every request and return that passes through our tool interfaces.
To build a usable interface across a heterogeneous XR SoC design flow, we construct dedicated wrappers tailored to specific tool paradigms. We wrap cycle-level architectural simulators (gem5) to extract IPC and contention metrics (Binkert et al. 2011). Wrappers for RTL simulators (Verilator) and verification harnesses (Cocotb) compile models and parse waveform traces (Veripool 2026). We wrap formal engines (such as SymbiYosys, an open-source formal verification front-end, and JasperGold, an enterprise formal verification platform) to serialize SystemVerilog Assertions (SVA), enforce Bounded Model Checking (BMC) cycle bounds (\(k\)-induction), and parse return proof certificates or counterexample Value Change Dump (VCD) waveform traces (Clarke et al. 2018). For implementation, we wrap synthesis and physical design flows (Yosys, OpenROAD) to translate constraints into stateful executions and parse slack signoffs (YosysHQ n.d.; Ajayi et al. 2019; The OpenROAD Project 2026). Finally, we wrap FPGA-accelerated simulators (FireSim, an open-source FPGA-accelerated simulation platform) to manage hardware targets and parse high-throughput traces (Karandikar et al. 2018).
To build a usable interface, we must clearly distinguish the underlying state from what the caller actually observes. We consider state to be the relevant condition of our design, software, tools, runtime, resources, and outstanding work. An observation, on the other hand, represents the authorized portion of that state, or a returned result, that we choose to expose to the caller. We define an action as a permitted, typed request complete with its own identity and preconditions, while a transition records exactly what changed when we accepted, completed, failed, canceled, or reset that action. A tool return combines the raw and structured output of a single attempt alongside its execution status. As we discuss in Chapter 7, we must evaluate whether any returned property can reliably support our measurement, update, or stopping decisions.
Our interface must also clearly define which project state the caller can read and which parameters it can change. For instance, an NPU-sizing wrapper might let us modify array dimensions and local memory buffer capacity while keeping interconnect topology, compiler flags, and memory traffic profiles strictly read-only. We ensure the wrapper outright refuses any request falling outside this permitted action set, rather than silently projecting our request onto the nearest supported design.
When we standardize attributes across our tooling, we eliminate accidental interface differences without obscuring the tool’s core meaning. When we share the same request identity, allowed actions, job status, errors, cost, cancellation, retry, and lineage tracking, multiple methods can leverage a single tool path under unified action and budget rules. This consistency also allows our methods to move flexibly among compatible tool paths without forcing us to reimplement scheduling and failure handling. While the resulting request and execution records become directly comparable across our methods, the actual measurements, candidate quality, and conclusions remain distinct. We can only replace a wrapper or tool path when its declared capabilities, properties, conditions, schemas, and semantics align. Even then, we require each wrapper to expose its supported operations, stages, properties, fidelities, units, assumptions, defaults, and warnings.
Capability and schema discovery make this separation fully inspectable. We ensure each request and return explicitly records the versions of the wrapper, request-schema, return-schema, parser, and underlying tool. This allows our callers to inspect supported actions and parameters before submitting any work. If a request is unsupported, our interface refuses it outright rather than silently dropping an argument, changing a default, or substituting a different fidelity. We never reinterpret a retained request under a newer schema; instead, we handle explicit migrations by creating a brand-new request artifact that links back to the original.
We must treat errors as a first-class part of our interface. Validation errors, tool diagnostics, missing outputs, parse failures, and unclassified warnings must remain distinct and retain their original text. While a typed result makes routine values much easier to consume, our wrapper cannot discard output just because the current schema fails to recognize it. When we keep raw output, parsed attributes, execution outcomes, and run identity on strictly separate paths, as mapped in our tool interface architecture in Figure 6.1, we prevent one component from silently assigning meaning to another component’s result.
Our environment does not necessarily need to return a single scalar reward. We might design a method that later derives an objective or reward from the returned values, but this derived value must remain separate from our raw observations and can never replace them. Consequently, a shared interface standardizes how we request and return work, intentionally leaving our architecture objectives and nuanced interpretations outside the wrapper itself.
When structured hardware representations match the underlying artifact, they can reduce ambiguity. For example, Circuit IR Compilers and Tools (CIRCT), an open-source hardware compiler infrastructure project, provides documented hardware MLIR dialects (such as HW, Comb, and SV dialects) and compiler passes that let us operate directly on structured intermediate representations (ASTs and CDFGs), sparing us from treating every change as a fragile textual source edit (CIRCT Project n.d.). However, we view this as a useful interface technique rather than the definition of an environment. Sharing a CIRCT operation, a JavaScript Object Notation (JSON) schema, or a simulator request does not make two tools equal in fidelity. Our chosen tool model, setup, and returned properties still dictate exactly what each observation contains.
CIRCT Project. n.d. CIRCT Dialects and Passes. Official project documentation. https://circt.llvm.org/docs/Dialects/.
Before we introduce a wrapper into a study, we should test its translation and control paths using known fixtures. We design each fixture to pair a typed request with its expected command line, translated inputs, retained artifacts, and parsed return. Our legal test cases must match the values reported by tool introspection or those preserved in the translated input, just as our illegal requests must be decisively refused. When we enforce these checks, we catch silent defaults, unexpected unit conversions, stale working state, and parsers that mistakenly accept output from the wrong run.
We also use failure injection to exercise the error-handling mechanics that our routine runs seldom reach. Our test harness can force a timeout, kill a process, omit or truncate output, and intentionally leave stale state, allowing us to verify our cancellation, retry, reset, and parsing behaviors. We must rerun these tests whenever our wrapper, parser, schema, library, or tool version changes. Passing tests only prove that our translation, control, state management, and parsing behave as declared for those specific requests, faults, states, and tool versions; any untested combinations remain unknown.
Cloud systems offer us a valuable precedent here. Frameworks like FATE, a failure testing service, and DESTINI, a declarative testing framework, inject faults to exercise recovery paths and verify whether the resulting behavior matches a formally declared recovery policy (Gunawi et al. 2011). While we can adopt this testing philosophy for an EDA wrapper, we must recognize that borrowing from the cloud community does not automatically prove our wrapper preserves architecture meaning, covers tool-specific failure modes, or guarantees that a recovery retry is safe. To make those claims, we still need purpose-built fixtures and fault injections tied directly to our actual tool paths.
Gunawi, Haryadi S., Thanh Do, Pallavi Joshi, et al. 2011. “FATE and DESTINI: A Framework for Cloud Recovery Testing.” 8th USENIX Symposium on Networked Systems Design and Implementation (NSDI 11) (Boston, MA), March. https://www.usenix.org/conference/nsdi11/fate-and-destini-framework-cloud-recovery-testing.
Once a request successfully crosses our tested interface, the runtime must keep the request’s identity perfectly intact while the work waits, runs, fails, or returns.
6.5 Managing Asynchronous Tool Execution
Executing an architecture request is rarely as simple as invoking a synchronous function call that returns a prompt answer. A cycle-level simulation may require hours of host execution, while a physical place-and-route run might spend half a day queued behind competing jobs waiting for a commercial license token. As these long-running tasks progress, they store checkpoints across distributed file systems and emit streams of intermediate logs out of order. To coordinate these asynchronous, multi-stage runs without losing track of execution context, we rely on scheduler adapters that bridge our harness to underlying cluster management systems.
A familiar reinforcement-learning environment presents a synchronous step() interface that returns an observation, reward, termination flags, and auxiliary information (Towers et al. 2025). We generally cannot reduce architecture execution to such a simple exchange. Our runtime has to preserve the complex queueing, dependency, persistent state, and ordering behaviors we just described, along with the typed tool returns. When we actually need a reward, our methods can derive one afterward from this rich execution data. This adapter maps our stable harness operations, like submitting a job, inspecting its status, and canceling it, onto a specific backend (such as Slurm, an open-source cluster workload manager, IBM Spectrum LSF, an enterprise workload scheduler, or cloud container schedulers). However, it does not replace our tool wrappers; we still rely on those wrappers to own the tool-specific validation, translation, invocation, and parsing.
Towers, Mark, Ariel Kwiatkowski, Jordan Terry, et al. 2025. “Gymnasium: A Standard Interface for Reinforcement Learning Environments.” Advances in Neural Information Processing Systems 38. https://proceedings.neurips.cc/paper_files/paper/2025/hash/d7ff1795e8527f6443371c3933bdb52b-Abstract-Datasets_and_Benchmarks_Track.html.
At a minimum, we require that a caller can inspect backend capabilities and state, submit a typed request, receive an attempt identifier, inspect or cancel that attempt, and ultimately receive its raw and parsed returns, status, warnings, cost, and lineage. The runtime object relationships and independent status attributes keep one authorized try inspectable end to end (Figure 6.3).
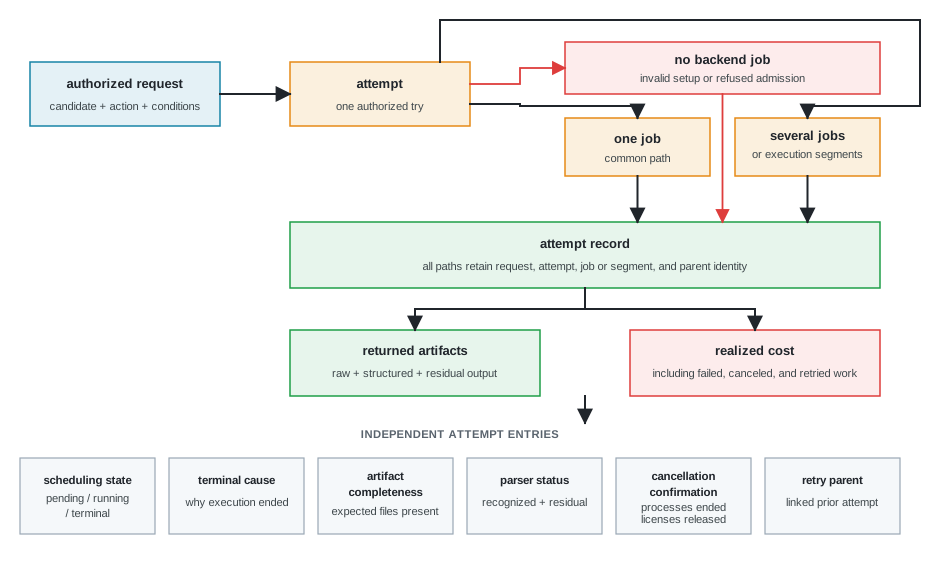
An authorized request instantiates a single attempt record, the same per-invocation execution record that Chapter 3 introduced, and that record mediates all interaction with our execution backends. A single attempt record can correspond to zero backend jobs if admission fails, a single job for a straightforward simulation, or multiple execution segments for multi-stage physical-design flows. The attempt record acts as an immutable anchor, pointing directly to raw returned artifacts and realized compute costs while tracking six independent status properties, including scheduling state, terminal cause, artifact completeness, parser status, cancellation confirmation, and retry parent link. For example, if a request fails admission, our harness still generates an attempt record even though no scheduler job exists. When we decouple object identity from state classification, we ensure that a terminal process state never falsely implies that artifacts are complete, nor does a failed job lose its realized cost accounting.
When we make a request, we specify an allowed action for a candidate under declared conditions. We define each authorized try as an attempt. Every job and segment we spawn retains that attempt identifier. If our study requires an intentional repeat, we treat it as a planned new attempt; in contrast, a recovery retry is a new attempt we authorize because our prior execution failed or returned incompletely. We develop the detailed retry policy in the Recovery section later in this chapter.
Our reference runtime attaches every job or segment to its attempt at submission, before a late result can arrive. It keeps dependencies explicit. A compiler build may wait for a source artifact, an RTL simulation in Verilator or VCS may wait for elaboration, and a physical implementation in OpenROAD or Vivado may wait for a mapped netlist from Yosys. Independent jobs can run concurrently without relaxing identity or resource limits. Because the scheduler might accept work before the runtime records the job identifier, the design tags submitted work with the attempt identifier and reconciles its records with the scheduler before resubmitting. The interface uses submission_token as an idempotency key, a unique request identifier whose durable backend handling prevents a repeated submission from launching duplicate work. A conforming backend records the key with the first admission result, returns the existing attempt or job for later submissions carrying that key, and rejects reuse for a different request (Featonby 2021).
Featonby, Malcolm. 2021. Making Retries Safe with Idempotent APIs. Amazon Web Services. https://aws.amazon.com/builders-library/making-retries-safe-with-idempotent-APIs/.
A backend status of running does not establish useful progress. Whenever the tool or backend exposes them, our harness retains advisory metrics, such as the last heartbeat or output time, the current tool stage or checkpoint, and any resources or licenses still held. We can use these indicators to support escalation or cancellation decisions, but we never let them prove architecture progress or validate a returned result.
When we design our authorization, we strictly follow the established security principle of least privilege (Saltzer and Schroeder 1975). We ensure a wrapper receives only the executables, filesystem paths, network destinations, credentials, secrets, licensed features, and intellectual property needed for its declared action. We treat generated scripts, constraints, RTL, and compiler inputs as untrusted until we validate and confine them. Consequently, we isolate every attempt within its own dedicated working area, strict resource limits, and strong process boundaries. If we fail to do this, a malformed RTL candidate might corrupt a shared worktree, fill a disk, exhaust host memory, or wedge a license process. When our harness enforces isolation, it safely traps failures and returns control without mistakenly treating the candidate as fully measured.
Design principle: Automate tool actions only inside a recoverable boundary
The principle: Autonomous tools and agentic scripts must execute generation, simulation, and parsing actions strictly within sandboxed, resource-bounded environments.
The application: Execution wrappers and harnesses must enforce hermetic tool boundaries, explicit time and memory budgets, and complete lineage tracking, ensuring that infrastructure failures never pollute hardware evaluation records.
We apply this exact same confinement to the material we supply to our models, just as we do for our tool processes. Our projects operate in segregated workspaces, with isolated retrieval indexes, caches, checkpoints, model contexts, logs, and credentials. We tightly scope each resource to its specific project, permissions, confidentiality limits, and retention policies. For every request, our wrapper selects an authorized context set, permits only explicitly declared egress routes, and refuses to send any material not authorized to cross the destination boundary. We only allow the reuse of caches or checkpoints across scopes when their identities and permissions match. While these controls reduce accidental mixing and disclosure, we still require separate manual reviews for source permissions and generated-output provenance.
We apply budgets independently across our model calls, tool submissions, elapsed time, CPU and accelerator usage, memory, storage, and license occupancy. Our admission checks reserve scarce resources before we ever dispatch a job. Even an accepted request might still be queued, canceled, or fail outright; similarly, a seemingly completed run might still be missing a critical artifact. We use these distinct states to determine exactly what our runtime records and which recovery actions remain available to us.
Our automated work inevitably shares queues, machines, storage, and software licenses with human engineers and massive production flows. When these shared resources saturate, our environment applies the site’s in-flight limits, project quotas or priorities, reservations, and backpressure to slow down or outright refuse new work. We design the environment to expose pending work, accepted work, and remaining authorizations, ensuring our methods never blindly resubmit just because a queued job has not become visible yet.
Cancellation is not complete the moment we issue a stop request. Instead, our harness explicitly requests the termination of all descendants, and then confirms both process termination and license release. We know a process might stop after producing partial artifacts, or it might rush to completion before our cancellation even takes effect. We ensure any late return remains permanently attached to its original attempt, keeping it out of our live state until the current request revision and our strict budget policies officially admit it.
We enforce a finite deadline for every attempt to confirm its terminal state. Our timeouts clearly state whether they bound a queue wait, a run time, a single tool stage, or serve as an absolute wall-clock deadline. If we find that scheduler and process states disagree, or remain unknown past that deadline, our harness retains the attempt as unconfirmed, quarantines the uncertain outputs, and prevents any late writers from mutating our live state. We preserve enough of the partial state to explain exactly what happened. This explicit confirmation step is how we transform a cancellation request or timeout into a controlled runtime outcome.
The reference execution interface keeps every request identifiable as it moves through validation, admission, scheduling, termination, artifact inspection, and parsing. In the common case, a single attempt produces one scheduler job, but the record keeps those stages and their outcomes distinct.
Our records must answer precisely what we requested, what actually ran, how it ended, and what it cost us. We use the request and the run specification to define our authorized work. We then rely on our attempt, job, and segment identifiers to show us exactly what reached a backend. Our attempt record joins all these objects to the returned material and our realized cost. Keeping these concepts separate prevents a simple retry from spawning a new candidate, or an intermediate scheduler job from masquerading as a final architecture result.
We use candidate_id to uniquely name our architecture candidate across all tool paths. We use configuration_id to name that candidate’s declared tool-specific configuration record for the requested path, rather than naming the translated files themselves. Once we validate those translated files, we assign them separate artifact identifiers and hashes. We retain both identities because a single candidate might require several tool-specific configurations, while we might also execute several attempts using the exact same candidate and configuration.
Before submission, our harness retains the request, the authorized attempt, and all translated inputs. If we hit an invalid translation, an unmet setup dependency, an exhausted budget, or a refused admission, we simply produce an attempt record with no scheduler job rather than letting the failure quietly disappear from our records. Once the backend accepts the work, we link the job to the attempt through its entire lifecycle, while it is queued, running, and terminal. A terminal process still requires us to perform full artifact inspection and parsing.
After the process stops, we ensure the very same attempt record retains the terminal cause, our expected-artifact check, the parser status, the raw and structured output, any retry eligibility, resource use, cost, and full lineage. When we keep these attributes separate, our runtime easily distinguishes a tool crash from a missing report or an outdated parser.
We record our resources separately instead of collapsing them into a single cost value. Our harness preserves tool and candidate identity alongside submission, queue, start, completion, and elapsed times. We also track our central processing unit (CPU) and accelerator usage, peak memory and storage, license occupancy, model and tool calls, retries and cancellations, and any linked setup, diagnosis, review, and repair work.
For our scheduler-managed resources, our records distinguish between reserved, consumed, and billable amounts whenever they are available; we explicitly give their units, and we name the specific scheduler, license server, or billing system that supplied each value. We leave any variables that our environment cannot directly observe explicitly unreported. We also allow human work to attach to a group of attempts whenever a single setup or diagnosis effort supports several invocations.
The decisive distinction we draw is between one identified candidate-configuration pair and the many attempts we might use to execute it. When we retry the same pair, we increase our realized cost, but we do not create another candidate, a new tool-specific configuration, or a fully independent observation. The setup and cost we record must travel alongside any returned value that later becomes data. When we enforce this requirement, we ensure that a later study can accurately compare time, compute, storage, and license use without treating a cycle simulation, a physical-design run, and a simple model call as equivalent samples.
Design principle: An unrecorded execution cannot justify an architectural claim
The principle: Every tool attempt must produce an immutable execution record detailing what ran, what configuration was passed, how the environment behaved, and what compute was spent.
The application: A returned value with no attempt record cannot enter a comparison, and a retry without lineage cannot be distinguished from a new candidate.
Before we ever choose a retry, a reset, a checkpoint, or a cached artifact, our harness must first determine exactly what the attempt returned. However, it never assumes that a returned value is inherently valid or that our candidate should automatically advance.
6.6 Categorizing Tool and Environment Failures
When an automated workflow dispatches hundreds of tool runs across a computing cluster, executions fail for vastly different reasons. A job might terminate because an EDA license server ran out of seats, a host node ran out of memory, a parser encountered an unfamiliar syntax error, or a synthesis run genuinely violated a timing constraint. If our environment naively collapses all these outcomes into a single FAILED bit, it risks penalizing viable candidates for transient infrastructure glitches or wasting compute retrying physically impossible designs. To keep our design space search uncorrupted, we must strictly separate execution status, which records what ran, from architectural evaluation, which judges what the outcome means. We establish this separation through the execution failure taxonomy detailed in Table 6.1.
| Execution outcome | How it appears | What our harness preserves | Our runtime response |
|---|---|---|---|
| Invalid request | We find an illegal value, missing identity, or meaning-changing translation before invocation. | Request, validation rule, and refusal reason. | We repair syntax only when meaning is preserved; otherwise, we refuse the request and return it to the candidate-producing caller. We reopen method selection only if the failure invalidates our chosen approach or its supported action space. |
| Setup or dependency failure | We detect that the top level, clock, library, constraint, checkpoint, or generated input is missing or stale. | Setup check, diagnostics, partial artifacts, and realized cost. | We restore or regenerate the declared state, leaving the candidate unevaluated. |
| Infrastructure failure | We find a license, host, scheduler, or storage service unavailable. | Attempt, failure source, partial artifacts, cost, and retry eligibility. | We retry only under the declared policy, leaving the candidate unevaluated. |
| Tool failure | The tool crashes (such as a Vivado routing error, gem5 out-of-memory exception, or VCS elaboration failure), reports an internal error, or exhausts a local resource. | Tool status, diagnostics, partial artifacts, conditions, cost, and retry history. | We retry, reset, resume a valid checkpoint, or stop. We recognize that repetition does not prove physical infeasibility. |
| Incomplete return | We notice a stage or expected report is missing, stale, or only partly written. | Completed stages, expected-artifact check, produced files, raw output, and parse status. | We preserve the partial return and repair or rerun before treating it as complete. |
| Parser failure | A retained artifact does not match our declared schema or contains unclassified output. | Parser version, raw artifact, diagnostics, recognized elements, and residual output. | We repair the parser and reparse the retained artifact when it is safe to do so. |
| Formal-tool return | The declared method and tool (such as an SVA/BMC checker) report their exact outcome, which may include a proof, counterexample VCD trace, bounded result, unknown, or resource limit. |
Method, property or relation, model, assumptions, bound where applicable, tool, exact outcome, artifact, and cost. | We hand the method-specific result forward without turning it into a general correctness verdict. |
| Reported design-limit violation | A completed run reports a timing (such as OpenROAD WNS \(< 0\)), power, congestion, design-rule, or functional violation. | Typed violation, units, candidate, conditions, warnings, raw artifact, and cost. | We record a complete return without rejecting or penalizing the candidate. |
| Complete tool return | Our expected artifacts exist and parse successfully, including reports that contain violations. | Typed data, units, conditions, warnings, raw artifacts, cost, and lineage. | We retain the return for measurement qualification without deciding what it establishes. |
When we incorporate formal tools, maintaining this separation becomes especially critical. Model-checking variants often report different outcomes and attach unique assumptions, bounds, or artifacts (Clarke et al. 2018). Rather than translating every completed formal run into one generic status, our environment preserves the exact terminology reported by each specific formal method and tool, including theorem provers and equivalence checkers.
Our execution condition determines both the retained record and our next action. When we encounter invalid requests, setup failures, and infrastructure failures, we leave the candidate unevaluated. If we hit tool, artifact, or parser failures, we rely on different owners to repair them. Although a formal-tool return and a reported design-limit violation are completed returns rather than process failures, neither supplies us with a broad design verdict. We pass every completed result forward with its scope intact.
We only consider a clean exit as a complete tool return after our expected-artifact check and parser succeed. Consider a synthesis script in Yosys or Vivado where we select no valid top-level module and omit the primary clock. Even though the process might exit with a status of zero and produce empty reports, our harness records a completed process alongside the missing artifacts and failed setup checks, rather than incorrectly substituting zeros for area, power, and timing.
Physical-design stages illustrate why a complete return may still contain a reported limit violation. Logic synthesis returns a mapped netlist, constraints, warnings, and early area and timing estimates, but lacks any placed or routed interconnect. As we move through the flow, floorplanning and placement add locations, utilization, congestion estimates, and a tool database. Finally, our clocking, routing, and power analysis stages contribute stage-specific timing, design-rule, congestion, and power results (Ajayi et al. 2019; The OpenROAD Project 2026). We record exactly which stage produced each artifact, ensuring an early estimate cannot masquerade as a later report.
The OpenROAD Project. 2026. OpenROAD User Documentation. https://openroad.readthedocs.io/en/latest/main/README2.html.
Table 6.1 distinguishes operational faults like license exhaustion or syntax errors from architectural outcomes like formal proofs or timing violations. For instance, an Infrastructure failure (such as an unreachable license server) prompts a host retry without penalizing the candidate, whereas a Reported design-limit violation (such as negative slack in OpenROAD) produces a complete, schema-valid return that records the physical violation without marking the run as a tool failure. Matching our runtime response to the exact failure category prevents transient infrastructure glitches from corrupting our candidate evaluation while ensuring that true physical design limits remain accurately recorded.
Our signoff returns remain strictly tied to the tool, libraries, corner, mode, constraints, warnings, and waivers that produced them. They never cover properties or conditions that we did not run. Consequently, even when we receive a complete signoff return, it supplies us with neither architecture interpretation nor authorization to proceed.
We always keep raw logs as part of the return. A commercial EDA tool or a detailed simulator may emit exceptionally long logs, and as we know, a language model can easily miss relevant text within a long context (Liu et al. 2024). However, discarding everything outside a fixed parser is equally unsafe. Instead, our wrapper returns structured elements for recognized metrics and failures, an explicitly marked residual of unclassified warnings and errors, and both a retrievable artifact identifier and an integrity hash for the complete raw log.
Liu, Nelson F., Kevin Lin, John Hewitt, et al. 2024. “Lost in the Middle: How Language Models Use Long Contexts.” Transactions of the Association for Computational Linguistics 12: 157–73. https://doi.org/10.1162/tacl_a_00638.
We must be cautious that our parser does not recognize only yesterday’s warnings. A new warning about a downgraded timing constraint or changed clock definition can easily appear after we upgrade a tool. Because we never taught our parser the new warning class, it produces a dangerously clean, structured record if it simply drops unclassified lines. We must preserve unclassified warning and error lines alongside the raw log. Although a compact return should reduce our reading cost, it must not grant the parser permission to decide that unfamiliar output is irrelevant.
We apply this same rule to partial returns. A placement density map produced just before a router crash may help our later diagnosis, but it remains a purely partial artifact. Our environment records exactly what stage produced it and what never ran. Later, during our measurement qualification, we determine whether that artifact actually bears on any claim.
Once we classify these outcomes, our harness can choose an allowed repair, retry, reset, checkpoint resume, cache reuse, or outright refusal, all without mistakenly treating a complete return as failed work.
6.7 State Recovery, Caching, and Artifact Reuse
Classifying an execution failure is only the first step; our harness must next decide how to recover without corrupting our evaluation lineage or burning redundant compute. If an infrastructure fault kills a process mid-simulation, we may want to restart from an intermediate checkpoint. If a script fails due to an invalid path, we might repair the wrapper and rerun the attempt. However, if we blindly reuse cached artifacts or resume from dirty working directories without validating their underlying dependencies, we risk polluting our dataset with stale results. Automated recovery and caching remain safe only when every tool flag, library view, and input hash cryptographically matches the declared request. If we merely pause the scheduler and continue the same submitted job, it retains its original identity. However, when we authorize a restart from a checkpoint or perform a clean reset, we create a linked but distinct attempt. If a retry loses this lineage, our automated methods might mistake it for a brand new candidate, double-counting our evaluation evidence and rendering the sequence irreproducible. If we observe repeated failures under controlled conditions, we might expose a reproducible tool problem, but we have not necessarily proven that the design is physically infeasible.
How we handle recovery depends on the class of failure. We repair invalid requests before a tool ever runs. If we encounter setup and parser defects, we usually require a clean restart once we fix the wrapper. Conversely, if we hit a transient host or license failure, we can often just retry the job. Eligibility for these retries hinges directly on the underlying cause. In our run specification, we assign recovery retries a declared maximum or budget. We then recheck admission requirements, ensuring that any clean restart or checkpoint resume relies on compatible, explicitly identified state. If we find that an upgrade caused the failure, reverting to the last pinned version generates a new attempt rather than quietly rewriting the existing record.
We apply the same strict rules for identity and permissions to ensure safe caching. We can only reuse a complete return when its project scope, permissions, inputs, transformations, tools, libraries, PDK views, flags, conditions, and relevant state perfectly match the cache key. Even if a checkpoint or cache entry technically matches, we never let it cross into another project, confidentiality boundary, or license scope without explicit authorization. When we place a generator in the tool path, its context window becomes a critical part of that state. We must clear this window between evaluating an open-source baseline and analyzing proprietary work, just as we would refuse to reuse a cache entry across different scopes. While partial and failed outputs might help us diagnose issues, we never serve them as completed observations. Finally, if we detect any unknown dependencies, we invalidate the cache entry.
Reusing cached timing or layout views across a design revision carries operational risk.
Failure mode: The stale library view
The trap. A team updates RTL and timing constraints for a faster clock target, reruns static timing analysis, and receives a clean signoff report for a design that cannot meet its own bus timing.
The mechanism. The timing analyzer silently loads an older library view from a cached prior process corner. The stale view lacks the setup and hold characterization for the accelerated path, so nothing fails, because the failing checks were never loaded. We present this as an illustrative composite; misapplied library data is a standing hazard class that modern signoff flows guard against with explicit view validation.
The lesson. Reusing stale library views or failing to flush cached tool workspace state produces deceptively clean signoff reports for failing designs. Architecture harnesses must validate PDK, LEF, and Liberty view checksums against candidate specifications before executing timing signoff.
This lesson extends far beyond a single accident. Reuse remains defensible only when we can establish that the conditions making the prior execution meaningful still hold.
6.8 Execution Records
Once we establish rules for safe state recovery, caching, and artifact reuse, we need an auditable framework to capture every tool attempt. To make our execution history truly auditable across a complex study, we cannot rely on informal directory structures or ephemeral terminal outputs. Every tool invocation leaves behind a trail of raw transcripts, synthesized netlists, timing reports, and resource bills. If we discard the raw outputs in favor of a few extracted numbers, we lose the ability to re-examine suspicious runs when our parsers evolve; if we save only unorganized log files, inspecting hundreds of attempts becomes unmanageable. We resolve this dilemma by constructing formal execution records that pair raw execution artifacts directly with structured metadata.
Historical perspective: MIT Whirlwind and the core memory reliability threshold
The breakthrough: Jay Forrester’s MIT group described three-dimensional magnetic core storage in 1951 (Forrester 1951), and by August 1953 Whirlwind’s troubled electrostatic storage tubes had been replaced with the first core memory in reliable production use.
The lineage: The electrostatic storage tubes were notoriously unreliable, losing data as stored charge leaked and drifted. Core memory brought a marked increase in operating speed and a dramatic improvement in mean time between failures (MTBF), enabling dependable real-time operation.
The lesson. Mean time between failures is an expectation, not a hard upper bound. As uncheckpointed execution time grows relative to MTBF, the expected recovery loss from host failure or compute preemption grows with it. Long-running synthesis and emulation therefore need checkpoint intervals that balance recovery exposure against checkpoint overhead, plus retained attempt records that distinguish infrastructure loss from an architectural result.
Forrester, Jay W. 1951. “Digital Information Storage in Three Dimensions Using Magnetic Cores.” Journal of Applied Physics 22 (1): 44–48. https://doi.org/10.1063/1.1699817.
We treat this as a logical record rather than a mandate to build a new database. We can map these attributes and links directly onto our existing run directories, scheduler records, artifact stores, and review logs, provided we keep the attempt identities and their relationships recoverable. The enclosing record carries our study and request context, preserves the ordered attempt identifiers, and aggregates costs without hiding any repeated or retried work.
At a minimum, we require every attempt to capture these core elements.
- Request and attempt identity: We track the study, request, run specification, candidate, configuration, workload, software, conditions, and the unique attempt identifier.
- Starting state: We record the exact inputs, source revisions, artifact identities, and any behavior-affecting state and versions necessary to interpret or repeat the attempt.
- Execution outcome: We log whether the request was refused, or if the attempt failed, was canceled, returned partially, or completed. We also note the terminal cause, termination confirmation, artifact and parser status, and retry eligibility.
- Returned material: We retain raw artifacts and logs, hashes, structured values with their units, warnings, unclassified residual outputs, and measures of artifact completeness.
- Lineage and retry relation: We preserve parent inputs and artifacts, recorded transformations, and whether the attempt serves as an initial run, a planned repeat, or a recovery retry, alongside any retry or reset parent.
- Realized cost: We account for the amounts and units actually spent, capturing all failed, canceled, repeated, and retried work.
We can introduce tool-specific extensions to add meaning without altering the underlying attempt identity. For instance, an SVA/BMC formal run adds its properties, assumptions, bounds, solver outcomes, and any resulting proofs or counterexamples. An OpenROAD or Vivado physical-design run incorporates libraries, PDK views, modes, corners, constraints, waivers, stage databases, and stage statuses. A gem5 or Verilator sampled simulation includes its seed, region, warm-up period, checkpoints, thread count, and declared sources of variation. Our resource services might attach queue and run times, compute usage, memory, storage, license occupancy, and any reserved, consumed, or billable amounts alongside their units and sources. None of these extensions elevate a simple retry, stage, or resource report into a separate architecture result.
We must keep our unknowns explicit. If a value is unavailable or unobservable, we mark it as unreported or unknown; if a particular attribute simply does not apply, we indicate that separately. We never try to repair a missing seed, library view, or raw report by leaving its entry blank. Resource use represents just one part of the record, it never substitutes for a rigorous accounting of our starting state, status, lineage, or returned material.
What another architect can actually achieve with our records depends heavily on who repeats the work and the setup they use. The Association for Computing Machinery (ACM), an international learned society for computing, distinguishes three related claims (Association for Computing Machinery 2020). Repeatability means that our own team uses the same experimental setup to obtain the result again. Reproducibility means that a different team obtains the result using our original setup. Replicability means that a different team obtains the result using a different setup. In this chapter, we use exact replay as a narrower, book-specific term to describe submitting the identical retained request, artifacts, versions, and recorded state over again. A replay record simply shows that we requested the exact same retained inputs; it does not guarantee an identical realized execution or matching output bits. Across our architecture work, all four of these claims still require a shared agreement to interpret them meaningfully against the properties, variations, and operating conditions we are actively studying.
Association for Computing Machinery. 2020. Artifact Review and Badging, Version 1.1. https://www.acm.org/publications/policies/artifact-review-and-badging-current.
Jimenez, Ivo, Michael Sevilla, Noah Watkins, et al. 2017. “The Popper Convention: Making Reproducible Systems Evaluation Practical.” 2017 IEEE International Parallel and Distributed Processing Symposium Workshops (IPDPSW), 1561–70. https://doi.org/10.1109/IPDPSW.2017.157.
We can look to the Popper Convention, a protocol for reproducible hardware and software experiments, for a strong systems precedent on placing experimental steps, parameters, and dependencies directly into a version-controlled, executable workflow (Jimenez et al. 2017). While this practice makes an architecture experiment easier to inspect and rerun, it cannot by itself package licensed tools, proprietary process design kits, or protected design data. An executable workflow alone does not prove that two distinct tool paths preserve the same architectural meaning.
While hashes successfully establish the identity and integrity of exact bytes, they do not prove that two netlists are equivalent, that two configurations express the same architecture, or that two separate runs support a valid comparison. To establish those deeper relationships, we require the relevant transformation records and subsequent checks. We must maintain this distinction even as a single candidate branches through several complex tools.
6.9 Orchestrating Multi-Tool Toolchains
In architectural evaluation, no single tool can give us every answer we need at a price we can afford. Analytical models can evaluate thousands of memory configurations in seconds, but they reveal nothing about software pipeline stalls; full-system emulators execute millions of workload cycles, yet they cannot tell us if a floorplan will close timing at a specific process node. To navigate this fundamental trade-off between simulation speed and physical detail, we organize our evaluation tools into a multi-fidelity spectrum, combining fast analytical estimators, cycle-level simulators, formal verifiers, and physical signoff flows into a unified toolchain.
We organize these evaluation options along a multi-fidelity spectrum, establishing a structured continuum of tool execution paths ranging from fast analytical estimators to cycle-accurate simulators, emulator platforms, and physical signoff flows. Eight evaluation tiers pair what each tool class models with the state our environment must preserve to maintain evaluation integrity (Table 6.2).
| Tool class | Representative use | What it models or checks | What our environment must preserve |
|---|---|---|---|
| Analytical or circuit model | Spreadsheet, CACTI (an integrated memory access time, area, and power model), SCALE-Sim (a cycle-accurate NPU systolic array simulator), or NPU analytical energy estimator (Muralimanohar et al. 2009). | Encoded equations or circuit and technology assumptions, without workload execution. | Model version, organization, technology assumptions, units, and limits. |
| Compiler and software build | Target compiler (TVM, IREE, an open-source intermediate representation execution environment compiler framework, and LLVM), lowering passes, assembler, linker, libraries, and runtime image. | Whether the declared source and mapping produce expected executable artifacts; no hardware timing or physical result. | Source and intermediate representations, target features, flags, mapping, library and compiler versions, diagnostics, and binary identity. |
| Functional instruction-set architecture (ISA) execution | Spike (a RISC-V ISA simulator) or QEMU (a generic machine emulator and virtualizer) ISA-level functional execution. | Instruction and software behavior under our implemented ISA model, without microarchitectural timing. | Binary, ISA options, input, termination state, and functional output. |
| Timing-model simulation | gem5 processor, SST (Structural Simulation Toolkit, an open-source modular parallel simulation framework), NoC interconnect, Ramulator 2 (a cycle-accurate DRAM memory simulator), and LPDDR5X memory controller timing simulation (Binkert et al. 2011). | Modeled pipeline, cache, interconnect, and memory timing under a chosen configuration. | Workload, software, warm-up, region, seed, configuration, event counts, and traces. |
| RTL simulation and verification harness | Verilator C++ model execution (Veripool 2026), Cocotb Python testbenches, or Synopsys VCS gate-level simulation with SDF (Standard Delay Format) timing back-annotation. | Cycle behavior under our supplied RTL and simulator/testbench semantics; no routed-delay result unless we explicitly supply such timing. | RTL identity, testbench, compile flags, reset, waves, assertions, and logs. |
| Formal property or equivalence tool | SystemVerilog Assertions and Bounded Model Checking (SVA/BMC via SymbiYosys, an open-source formal verification front-end, or JasperGold, an enterprise formal verification platform) (Clarke et al. 2018). | The stated property or equivalence relation within our declared assumptions, abstraction, and bound where applicable; no general correctness result. | Property and model identities, assumptions, abstraction, bound, solver version and outcome, proof or counterexample artifact, and cost. |
| Enterprise emulation and FPGA acceleration | Synopsys ZeBu, Cadence Palladium enterprise emulators, or FireSim target simulation on AWS F1 cloud FPGAs (Karandikar et al. 2018). | Accelerated functional execution or timing-model execution of our mapped target model. The emulator/FPGA implementation is not ASIC signoff. | Target model, emulator/FPGA image, host configuration, workload, and returned traces. |
| Implementation flow | Yosys open-source synthesis (YosysHQ n.d.), Xilinx Vivado FPGA build flow, and OpenROAD ASIC place-and-route with UPF power intent specs and OpenSTA (an open-source static timing analyzer) signoff (Ajayi et al. 2019). | Properties exposed by the declared stage, libraries, constraints, modes, and corners. | Every intermediate artifact, tool condition, warning, waiver, and stage result. |
Muralimanohar, Naveen, Rajeev Balasubramonian, and Norman P. Jouppi. 2009. CACTI 6.0: A Tool to Model Large Caches. HPL-2009-85. HP laboratories.
Binkert, Nathan, Bradford Beckmann, Gabriel Black, et al. 2011. “The gem5 Simulator.” ACM SIGARCH Computer Architecture News 39 (2): 1–7. https://doi.org/10.1145/2024716.2024718.
Veripool. 2026. Verilator User’s Guide. https://verilator.org/guide/latest/.
Clarke, Edmund M., Thomas A. Henzinger, Helmut Veith, and Roderick Bloem, eds. 2018. Handbook of Model Checking. Springer. https://doi.org/10.1007/978-3-319-10575-8.
YosysHQ. n.d. Yosys Open SYnthesis Suite. YosysHQ documentation. https://yosyshq.readthedocs.io/projects/yosys/en/latest/.
Ajayi, Tutu, Vidya A. Chhabria, Mateus Fogaça, et al. 2019. “Toward an Open-Source Digital Flow: First Learnings from the OpenROAD Project.” Proceedings of the 56th Annual Design Automation Conference (DAC), 1–4. https://doi.org/10.1145/3316781.3326334.
Eight hardware evaluation tiers span the fidelity range our environments must serve, and each tier obligates the environment to preserve different state (Table 6.2). Higher fidelity buys narrower model coverage and heavier state retention requirements. For example, while an analytical SRAM model requires preserving only technology parameters and basic circuit equations, an OpenROAD physical implementation flow requires retaining intermediate netlists, UPF power intents, Liberty library checksums, and signoff corner constraints. Fidelity is property-specific. No single tool models all microarchitectural and physical phenomena, so our environment must explicitly preserve each tool’s unique execution context rather than collapsing diverse returns into a single scalar score.
We must carefully weigh cost and property coverage to determine which authorized branches our study can realistically afford to execute. These tool paths differ not only in what they observe, but also in their underlying resource regimes. We can often reconstruct analytical models and compiler checks cheaply from our declared inputs. However, our cycle-level (gem5), RTL (Verilator/VCS), and formal (SVA/BMC) runs might prove lengthy, heavily resource-constrained, or even inconclusive. As we move to implementation flows in Yosys, Vivado, and OpenROAD, we take on persistent databases, stage dependencies, and licensed features. Our FireSim FPGA paths introduce complex image or build steps, deployment queues, calibration routines, and the bottleneck of scarce hardware access. To manage this complexity, our environment records the actual realized conditions and costs, rather than trying to infer them from the tool class alone.
ZSim (a fast x86 simulator) and FireSim clearly illustrate an important operational consequence, where throughput depends on our realized configuration, not just the tool class we choose. In one published setup, ZSim ran a detailed Westmere-class out-of-order model at 20 million simulated instructions per second, roughly \(200\times\) slower than the modeled core. That same study noted conventional detailed simulators running at around 200 thousand simulated instructions per second (Sanchez and Kozyrakis 2013). FireSim operates in a different regime. When we use FPGA-accelerated simulation, individual target nodes can run at tens to hundreds of megahertz; one notable 1,024-node configuration ran at 3.4 MHz for 3.2 GHz targets, achieving a slowdown of less than \(1{,}000\times\) (Karandikar et al. 2018). These rates are merely examples, not universal constants. Our modeled system, host or FPGA allocation, workload, instrumentation, accuracy target, and scale will all shift these numbers. Because of this variability, our environment records the observed throughput alongside its specific conditions, allowing our method to build budgets based on that precisely scoped rate.
Sanchez, Daniel, and Christos Kozyrakis. 2013. “ZSim: Fast and Accurate Microarchitectural Simulation of Thousand-Core Systems.” Proceedings of the 40th Annual International Symposium on Computer Architecture (ISCA), 475–86. https://doi.org/10.1145/2485922.2485963.
Karandikar, Sagar, Howard Mao, Donggyu Kim, et al. 2018. “FireSim: FPGA-Accelerated Cycle-Exact Scale-Out System Simulation in the Public Cloud.” 2018 ACM/IEEE 45th Annual International Symposium on Computer Architecture (ISCA), 29–42. https://doi.org/10.1109/ISCA.2018.00014.
Sherwood, Timothy, Erez Perelman, Greg Hamerly, and Brad Calder. 2002. “Automatically Characterizing Large Scale Program Behavior.” Proceedings of the 10th International Conference on Architectural Support for Programming Languages and Operating Systems (ASPLOS), 45–57. https://doi.org/10.1145/605397.605403.
Wunderlich, Roland E., Thomas F. Wenisch, Babak Falsafi, and James C. Hoe. 2003. “SMARTS: Accelerating Microarchitecture Simulation via Rigorous Statistical Sampling.” Proceedings of the 30th Annual International Symposium on Computer Architecture (ISCA), 84–95. https://doi.org/10.1145/859618.859629.
SimPoint and SMARTS teach us a separate but equally crucial lesson about sampling identity. While SimPoint, a profile-driven sampling tool, helps us select representative program regions, SMARTS, a statistical sampling framework, provides us with a robust basis for sampled simulation (Sherwood et al. 2002; Wunderlich et al. 2003). Our environment faithfully records our chosen regions, weights, warm-up periods, fast-forward policies, and checkpoint parents. However, it leaves the critical decision of whether those choices support our intended comparison up to us.
When we maintain an execution record that retains all transformation, calibration, and version identities alongside branch-specific conditions, we ensure that we can verify this correspondence without friction.
Let us consider our prospective mobile XR SoC candidate (incorporating a \(16 \times 16\) NPU accelerator tile, dual LPDDR5X memory channels, UPF power-gating domains, and a 3 MiB L2 cache). Our SRAM, SCALE-Sim, and analytical branch receives the precise cache organization and NPU tile configuration along with our declared process, voltage, and temperature conditions. Our compiler and runtime branch (via TVM/IREE/LLVM) binds the baseline software image, target NPU features, libraries, flags, and runtime into a uniquely identified binary. Our cycle-level branch (via gem5 and Ramulator 2) then takes that binary and candidate, linking them to our XR workload trace, memory controller traffic generators, cache and power models, warm-up phase, seed, and checkpoint. When we move to RTL simulation in Verilator or VCS, we add our generated RTL, testbench, compile flags, and reset parameters. Our formal checking path (using SVA/BMC) introduces specific named properties such as NoC deadlock-freedom and NPU buffer safety, along with our underlying assumptions, abstraction levels, bounds, and solver details. Logic synthesis in Yosys or Vivado brings in top-level constraints and cell libraries, while our physical implementation step in OpenROAD incorporates the floorplan, process design kit views, operating modes, corners, and any necessary waivers. We must treat these branches as distinct, non-interchangeable paths. In fact, only our screening models and cycle-level simulation branches will participate in the hypothetical fixture we explore later in this chapter. Throughout this process, our environment simply preserves every branch’s input, raw and structured returns, costs, conditions, and limits, remaining neutral without promoting or rejecting our candidate.
Chipyard, an open-source SoC design framework, makes this shared lineage visible. The cited framework explicitly documents the paths leading from a single configuration, through Chisel (a Scala-based hardware construction language) generation and Flexible Intermediate Representation for RTL (FIRRTL, an intermediate representation for hardware compiler passes) passes, directly into branch-specific tools for Verilator/VCS RTL simulation, VLSI implementation in OpenROAD, and FireSim FPGA-accelerated simulation (Amid et al. 2020). Our simplified view here does not attempt to serve as a definitive map of every Chipyard component or version. Instead, it illustrates how a common configuration supplies shared lineage across distinct tool paths, as shown in Figure 6.4.
Amid, Alon, David Biancolin, Abraham Gonzalez, et al. 2020. “Chipyard: Integrated Design, Simulation, and Implementation Framework for Custom SoCs.” IEEE Micro 40 (4): 10–21. https://doi.org/10.1109/MM.2020.2996616.
A single root configuration moves through Chisel hardware generation and FIRRTL intermediate compiler passes before fanning out into three distinct tool execution branches (Figure 6.4). The generated RTL enters software RTL simulators like Verilator or Synopsys VCS for cycle-exact functional verification; the netlist routes into physical design flows like OpenROAD for place-and-route timing signoff; and the design lowers into FireSim for FPGA-accelerated target simulation. All three branches share an identical configuration parent, yet each tool path consumes different intermediate collateral and emits non-interchangeable evaluation artifacts. Shared configuration lineage preserves parameter traceability across tool flows, but it does not make raw returns directly comparable across different fidelity tiers without explicit condition matching.
The choice of hardware evaluation environment establishes a trade-off among throughput, setup cost, and the kind of timing behavior a platform represents (Figure 6.5). The horizontal positions and bubble sizes are constructed to make that operational trade-off visible. The vertical positions are categories, not a percentage error or a ranking of physical fidelity.
RTL simulation resolves cycle behavior under the supplied RTL, testbench, and delay model; it does not establish post-layout delay unless that timing is supplied. FPGA acceleration executes a mapped target model more quickly after a substantial build, but the FPGA mapping is not ASIC timing signoff. Detailed microarchitectural simulators expose modeled cycle behavior at another abstraction, while functional instruction-set simulators answer software-behavior questions without producing a microarchitectural cycle result. Analytical bounds execute no target model. Fabricated silicon supplies measured behavior for the realized chip and test conditions, not a universal timing result for every operating point. No single platform optimizes throughput, setup latency, and property coverage, so we route each request to an environment that can observe the property at issue within our budget.
While shared lineage successfully identifies related artifacts for us, it does not dictate exactly when a branch is ready to run. ArchGym, an architecture-search evaluation framework, demonstrates how several architecture simulators can share a common interface under strict, controlled budgets (Krishnan et al. 2023). However, our project environment must go a step further. We need it to expose jobs that wait in queues, hold precious licenses, resume from checkpoints, and return results asynchronously, rather than obscuring all of this complex reality behind a single step() call.
Krishnan, Srivatsan, Amir Yazdanbakhsh, Shvetank Prakash, et al. 2023. “ArchGym: An Open-Source Gymnasium for Machine Learning Assisted Architecture Design.” Proceedings of the 50th Annual International Symposium on Computer Architecture, ISCA ’23, 14:1–16. https://doi.org/10.1145/3579371.3589049.
Cui, Angela, Ferran Hermida-Rivera, Jack Toubes, et al. 2026. CHIA: An Open-Source Framework for Principled, Agentic AI-Driven Hardware/Software Co-Design Research. https://doi.org/10.48550/arXiv.2606.27350.
CHIA, an open co-design framework, gives us a timely, architecture-specific example of bridging AI-directed hardware/software co-design with heterogeneous tool paths (Cui et al. 2026). Although we can appreciate its concrete integration, the framework alone cannot guarantee that every interface fully preserves our design meaning, securely contains failures, or ensures reproducibility across other projects and tool installations. We must ultimately rely on our overarching project environment to shoulder those heavy responsibilities.
When we construct a dependency graph, we clearly identify which branches can run concurrently and which must wait for an input. Modern workflow systems like Nextflow, a data-driven workflow management system, and Snakemake, a Python-based workflow automation tool, show us how to separate our workflow logic from the actual execution happening on local machines or computing clusters (Di Tommaso et al. 2017; Köster and Rahmann 2012). As we construct our broader design workflow, our run specification locks in the authorized work, while our harness coordinates everything through a scheduler adapter and backend. In this setup, Nextflow- or Snakemake-style workflow logic merely expresses execution dependencies, it never takes ownership of our design ordering, methodological decisions, results interpretation, or human review processes. Our scheduler might plan the authorized work, but it cannot unilaterally add a new tool, skip a required branch, or change our chosen fidelity level without us issuing a brand new request.
Di Tommaso, Paolo, Maria Chatzou, Evan W. Floden, Pablo Prieto Barja, Emilio Palumbo, and Cedric Notredame. 2017. “Nextflow Enables Reproducible Computational Workflows.” Nature Biotechnology 35 (4): 316–19. https://doi.org/10.1038/nbt.3820.
Köster, Johannes, and Sven Rahmann. 2012. “Snakemake—a Scalable Bioinformatics Workflow Engine.” Bioinformatics 28 (19): 2520–22. https://doi.org/10.1093/bioinformatics/bts480.
Whenever possible, we should run our inexpensive prerequisite checks before committing to expensive dependent work. If our declared syntax, interface, functional, or SVA/BMC equivalence check discovers that an artifact failed a predeclared prerequisite, our harness immediately records the return and suppresses only the dependent dispatch, stopping the flow well before costly synthesis or physical implementation steps in Vivado or OpenROAD. We do not rely on one rigid, universal tool order; instead, our specifically requested run dynamically determines the exact prerequisites and the branches we can afford to execute.
Our prospective XR SoC application brings all of these responsibilities together into a single run specification. It spans our pinned state, exact translations, tool dependencies, failure handling mechanisms, realized costs, and containment strategies.
6.10 Mobile XR Subsystem Evaluation Environment
To see how our environment rules, typed contracts, and multi-fidelity pipelines operate under concrete engineering constraints, we turn to a representative mobile XR SoC co-design study targeting a TSMC N7 or 3 nm-class process node. When we evaluate an extended reality subsystem, we must balance tightly coupled architectural trade-offs as we size a \(16 \times 16\) NPU matrix array, configure dual LPDDR5X memory channels, integrate UCIe chiplet links, specify UPF power domains, tune L2 cache capacity, and enforce gate-level physical synthesis boundaries, all while respecting a strict \(3\,\mathrm{W}\) thermal design power (TDP) envelope. In this scenario, we walk through how a multi-stage run specification manages state isolation, screening dispatch, failure containment, and lineage tracking across heterogeneous tools.
In our setup, we first pin the candidate and fixed state, and then define the request and return schemas for the screening analytical models (SRAM, SCALE-Sim, and NPU area/power) and the cycle-level simulators (gem5, Ramulator 2, and Verilator). Our run specification explicitly makes simulator dispatch depend on the declared screening returns. It also sets our attempt and time budgets, defines how we authorize resource and license usage, and establishes our reset and retry policy. Once execution completes, our harness retains every return alongside its realized cost.
Before we invoke any backend tools, we formalize our runtime governance in a prospective run specification, as detailed in Table 6.3. We examine this contract to establish explicit rules for state pinning, dispatch ordering, failure containment, and lineage retention before spending execution cycles on cluster jobs.
| Run category | Prospective XR SoC co-design study run specification |
|---|---|
| Candidates and fixed state | We bind the run specification and study revision to our candidate XR SoC configurations (varying l2.capacity between 2 MiB and 4 MiB, \(16 \times 16\) NPU array dimensions, and memory traffic arbitration). Only declared parameters vary. We keep the octa-core RISC-V RV64GCV CPU cores, NoC interconnect, baseline software image, and XR workload trace fixed. Each candidate retains its complete SRAM, NPU tile, LPDDR5X memory controller, UPF power domain, and TSMC 3nm technology identity. |
| Translation and identity | We serialize declared parameters exactly into analytical screening models (SRAM and SCALE-Sim) under declared process, voltage, and temperature (PVT) conditions, and into eligible gem5/Ramulator 2/Verilator simulator requests using declared UPF power models. We retain the identity of every behavior-affecting schema, wrapper, parser, tool, model, flag, host or container, seed, and reset state. |
| Order and dispatch | We run one screening evaluation per candidate before any dependent cycle-level work. We dispatch cycle-level gem5/Ramulator 2/Verilator simulations only when screening returns are complete, schemas are valid, combined area is at most \(1.5\,\mathrm{mm}^2\), and access latency is at most \(2.5\,\mathrm{ns}\). |
| Matched work and limits | We run the shared baseline and every eligible alternative under matched conditions. We allow three screening evaluations and at most four cycle-level attempts, including recovery retries. We enforce queue-wait, run-time, and absolute deadlines, stopping when authorized work completes, no alternative qualifies, or a budget expires. |
| Failures and recovery | We keep invalid requests, timeouts, cancellations, infrastructure failures, stale state, missing outputs, and parser failures strictly distinct. We link each recovery retry to its parent, charge it against our budget, and regenerate a clean working directory from the fixed state. |
| Containment and reuse | We grant access only to declared tools, paths, credentials, networks, and resources. We quarantine output after any unconfirmed termination. We reuse a complete return only when the request, candidate, conditions, translated inputs, tools, wrappers, parsers, and retained artifacts match perfectly. |
| Returns, cost, and lineage | We retain SRAM/NPU area, access time, energy, and leakage; matched frame records, LPDDR5X memory traffic inputs, NPU MAC utilization, subsystem power, and warnings; translated inputs, commands, raw logs, parsed outputs, residual artifacts, hashes, resource use, cost, and parent-child lineage. |
| Decisions left outside | Our environment does not decide whether a returned value is a valid measurement, whether two returns form a valid comparison, whether a reported limit establishes rejection, or whether a candidate should advance. |
A run specification becomes enforceable when every operational boundary carries an exact contract, which Table 6.3 states for the prospective mobile XR study. For example, under the Order and dispatch row, we set up a rule that authorizes a cycle-level attempt only after complete, schema-valid screening returns meet designated area and latency thresholds. This condition neither validates a measurement nor rejects a candidate on its own. When we codify these eight categories before calling a tool, our environment ensures that every attempt runs under strict budgets and isolated directories while leaving architectural evaluation to downstream analysis.
Our chronology starts with three screening runs. The 2 MiB rerun baseline, alongside our 3 MiB and 4 MiB alternatives, would return combined subsystem areas of \(1.2\), \(1.4\), and \(1.7\,\mathrm{mm}^2\) and access times of \(2.1\), \(2.4\), and \(2.8\,\mathrm{ns}\), respectively. While the first two candidates meet both of our declared thresholds, the 4 MiB candidate falls short. Consequently, our run specification blocks any dependent cycle-level dispatch for it. The values alone would not establish that decision without our verified parse status and recorded dispatch outcome.
Our eligible candidates then enter matched cycle-level runs under the four-attempt budget. The baseline would return a combined subsystem dynamic and leakage power of \(2.90\,\mathrm{W}\). If our first 3 MiB attempt encounters a stale-state setup failure, the harness authorizes a controlled retry from a clean reset, followed by a separate planned repeat. These attempts exhaust our budget. Although the recovery retry and planned repeat would return frame, cache, NPU MAC utilization, and power metrics, their specific values remain unreported here. Any summary we derive from them would constitute a new artifact, rather than another tool call.
To be complete, our resulting record must connect the three candidates, their screening returns, the eligible cycle-level work, the failed attempt, the retry and reset links, the planned repeat, every generated artifact, and the total realized cost. In this example, we leave several elements unreported, such as artifact identities, resource use, cost, output lineage, exact translated inputs and hashes, behavior-affecting versions, starting and reset-state identities, seeds and job times, parser and raw-artifact identities, and matched frame records. Because of these omissions, our record remains incomplete under Table 6.3 and the execution-record concept we introduced in Chapter 3. Later, Chapter 7 determines whether any of our complete returns can become a valid measurement, comparison, or basis for advancing a candidate.
Our harness maintains one exact identity connected across candidate state, translation, execution, reuse, and return. When we strictly enforce our dispatch conditions, budgets, deadlines, and stopping rules, we prevent an eligible candidate from authorizing unlimited work. When we execute a recovery, it consumes our budget while preserving its parent lineage. Our containment and retention policies keep failed or uncertain work fully reviewable without admitting it as a completed return.
We must write this entire specification before making our first tool call. If we fill it in afterward, we cannot definitively refuse a bad translation or demand a missing output. While our specification may authorize dynamic host selection, license reservation, pausing, and resuming, any fundamental change, such as substituting a tool path, serving stale state, or skipping the baseline, requires us to issue a new request.
6.11 Common Pitfalls
Even when we design clear interfaces and enforce strict schemas, real-world EDA toolchains present subtle operational failure modes that can silently compromise an architectural study. A simulation engine might quietly fall back to default parameters, a physical design tool might produce unroutable placement without throwing an error code, or a hardware emulator might execute stale memory checkpoints. The pitfalls below are practitioner-reported failure classes, composites we anticipate from the mechanisms above rather than cited incident reports. Recognizing these practical failure patterns helps us harden our harnesses against silent state corruption and invalid performance claims.
- Silent drifts in gem5 architectural simulation configurations: When we execute cycle-accurate architectural studies in gem5, a full-system architectural simulator, subtle default parameter changes across minor version revisions or unverified Ruby memory hierarchy flags can corrupt execution lineage.1 Automated flows that fail to lock exact gem5 build hashes and seed states produce non-reproducible cache latency and memory contention measurements.
1 Hermetic package management: In software engineering, pure functional package management and hermetic build graphs bind declared inputs, tool binaries, and environment dependencies to content identities (Dolstra 2006). In hardware evaluation, harness environments should likewise lock tool binaries, host OS libraries, seed states, and simulation flags. This supports replay and exposes remaining platform or tool variation; it does not guarantee identical cycle counts across compute clusters.
Dolstra, Eelco. 2006. “The Purely Functional Software Deployment Model.” PhD thesis, Utrecht University. https://nixos.org/~eelco/pubs/phd-thesis.pdf.
- Unmanaged license preemption in VCS RTL simulation flows: When we execute Synopsys VCS, an event-driven RTL simulator, under Slurm, a high-performance computing workload manager, we can encounter silent job preemptions and license check-out failures.2 Harnesses that treat license denials as hard design rejections corrupt dataset provenance by masking operational cluster limits as physical hardware incompatibilities.
2 Least privilege and fault isolation: Following the security principles of fail-safe defaults and least privilege, execution environments must cleanly separate infrastructure resource limits from candidate correctness (Saltzer and Schroeder 1975). Transient EDA license denials or cluster preemptions should trigger explicit infrastructure exception handling rather than polluting design evaluation records with false candidate rejections.
Saltzer, Jerome H., and Michael D. Schroeder. 1975. “The Protection of Information in Computer Systems.” Proceedings of the IEEE 63 (9): 1278–308. https://doi.org/10.1109/PROC.1975.9939.
- Failing to reset persistent state in FireSim FPGA-accelerated runs: FireSim, an FPGA-accelerated full-system simulation environment, relies on persistent host DRAM state and FPGA bitstream images across simulation runs.3 If an execution environment fails to force a hard reset of host memory and PCIe register state between candidate evaluations, residual kernel buffers can corrupt subsequent workload timing measurements.
3 State sanitization boundaries: Analogous to state sanitization and idempotency boundaries in cloud architectures, hardware simulation accelerators require declared memory and bus-register reset procedures between candidate evaluations. The reset supports independence only to the extent that it covers the persistent state capable of influencing the next run.
- Silent DRC violations and macro collisions in OpenROAD physical design: OpenROAD, an open-source physical design toolchain, can complete floorplanning and placement without automatically stopping on intermediate Design Rule Checking (DRC) errors.4 Automated environments that parse final area metrics without validating detailed routing reports can accept layouts with un-routable signal pin collisions or power grid shorts.
4 Intermediate signoff verification: Paralleling compiler fail-stop validation gates, an architecture evaluation harness must validate intermediate signoff reports before extracting physical metrics, preventing invalid CAD artifacts from entering downstream surrogate dataset pipelines.
- Stale memory map checkpoints in ZeBu and Palladium hardware emulation: ZeBu and Palladium, enterprise hardware emulation platforms, save execution checkpoints to accelerate long booting sequences.5 Re-using an emulation checkpoint after modifying register-transfer level memory controllers or bus interfaces can silently execute stale memory mappings, invalidating hardware verification results.
5 Emulation snapshot consistency: Reusing hardware emulation snapshots after RTL register modifications violates cache consistency invariants, analogous to executing database queries against a cached page after a schema migration.
- Uncontained coroutine deadlocks in Cocotb Python testbenches: Cocotb, a Python-based coroutine verification framework, interfaces with RTL simulators through standard procedural interfaces.6 When testbenches encounter unhandled coroutine exceptions or missing clock edges, Cocotb can hang indefinitely. Harnesses lacking explicit wall-clock timeouts starve Slurm queue allocations and block execution pipelines.
6 Watchdog timer isolation: Adopting watchdog timer design patterns from fault-tolerant operating systems, verification wrappers must enforce wall-clock execution limits to prevent unhandled coroutine deadlocks from leaking HPC compute resources.
6.12 Open Questions
While robust environment abstractions successfully separate execution mechanics from result qualification, scaling these boundaries across evolving EDA toolchains and multi-tenant compute clusters exposes deep open engineering questions. As automated design loops become more autonomous and tools become more stateful, managing permissions, fault diagnostics, and semantic fidelity across heterogeneous environments requires solving several unresolved challenges. We organize these research questions into three core domains encompassing infrastructure failure handling, cross-toolchain semantics, and execution containment.
Infrastructure failure classification and recovery. Handling unexpected EDA tool drops requires automated failure taxonomy at scale.
- How do we efficiently classify unexpected tool failures at scale? When thousands of tool runs fail across diverse EDA flows, automatically distinguishing recoverable license timeouts or memory limits from true design illegalities is essential for avoiding corrupted dataset lineage.
Cross-toolchain semantic preservation. Multi-fidelity tool chains must preserve design intent without introducing translation artifacts.
How can an automated method verify that a tool translation preserves our requested architecture change? We know basic syntax and type checks easily miss critical errors like silent defaults, rounding issues, unexpected generated collateral, and unsupported tool combinations. Our open research problem is figuring out how to rigorously compare the semantics of an incoming request against the translated artifact, without rigidly rejecting harmless, tool-specific syntax repairs.
How can an AI-native environment expose semantic differences among tool returns that look operationally alike? When we combine multi-fidelity tools, matching identities and numeric attributes can mask profound differences in modeled properties, assumptions, units, design stages, and fidelities. Our environment must make these structural differences explicit to the study without unilaterally deciding what architectural claim they actually support.
Execution validity and state containment. Stateful architecture tools demand strict authorization boundaries and clean reset mechanisms.
The long-running architecture tools we rely on, especially those in physical design or cycle-level simulation, maintain complex state and demand access to shared files, machines, licenses, and intellectual property. Our environment has to survive failures and state changes without confusing the workflow or quietly expanding its own authority.
How can an AI-native environment determine that a stateful architecture tool has returned to a valid starting state? Working directories, persistent databases, caches, checkpoints, random seeds, and host libraries routinely survive restarts. We need robust reset mechanisms that clear influential, run-specific state without paying the overhead of tearing down and recreating the tool session for every attempt.
How can our environment safely preserve useful partial or delayed tool results after the architecture state changes? Intermediate data, like an early placement map or a partial simulation trace, often remains diagnostically useful even when it no longer describes our current candidate. If we carelessly reuse this data, we mix incompatible states; if we eagerly discard it, we throw away expensive simulation or physical-design work. We must solve the open problem of tracking what remains semantically valid and carrying its lineage forward, without accidentally admitting it as current evaluation evidence.
How can an environment grant an AI system only the exact access needed for one architecture tool action? The scripts, RTL, constraints, and commands we generate might require specific files, tool binaries, licenses, and host machines, but they rarely need broad system credentials or external network access. As system builders, our challenge is designing strict, dynamically scoped authorization that grants just enough authority for valid work, while effectively containing malformed requests or adversarial actions.
6.13 Summary
In this chapter, we showed that tool-connected execution environments form the backbone of modern hardware evaluation. Without robust environment abstractions, automated architecture flows risk corrupting candidate state, misinterpreting tool crashes as design rejections, and losing track of evaluation lineage. When we wrap individual CAD, simulation, and synthesis tools and orchestrate them through isolated harnesses, we make a tool return identifiable, repeatable, and attributable to the request that produced it. That is the necessary condition for evidence, not evidence itself. Qualifying a return against the property it actually observed belongs to Chapter 7.
Our environments must strictly separate prospective run specifications, which define what we authorize to execute, from immutable execution records, which record what actually ran and what compute was spent. While our infrastructure manages job scheduling, reset policies, and fault containment, it never unilaterally decides whether a return constitutes a valid measurement or a winning candidate. When we evaluate this phase of AI-native co-design, four core takeaways govern our work:
Key Takeaways: Hermetic Execution and Its Records
- Hermetic tool wrappers and contracts. Encapsulate each simulation or EDA tool within a typed wrapper that validates inputs, applies a declared parameter mapping, and parses outputs deterministically.
- Strict runtime containment and budgets. Contain automated tool executions within isolated boundaries with explicit time, memory, and license limits, and record infrastructure failures separately from design results.
- Execution records as primary artifacts. Capture a versioned execution record covering candidate state, exact tool versions, seeds, raw logs, parsed outputs, and realized compute costs for every attempt.
- Separation of execution from evaluation. Execution harnesses record what ran and what returned, leaving measurement qualification, comparative validity, and candidate selection to downstream verification rules.
Our environment establishes what we requested, executed, returned, and spent, preserving the core identities needed to attempt local replay when the declared dependencies remain available. This is narrower than the reproduction a different team with a different setup would attempt. The environment cannot qualify a measurement, validate a comparison, or recommend a candidate on its own. Chapter 7 examines how these returned values and artifacts become useful feedback.